
Figure 1.
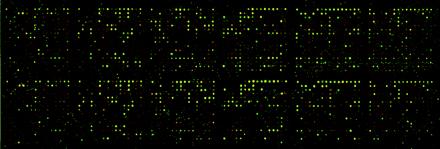
False-color image of microarray used to analyze transcript levels in cultured A549 cells after incubation with P. aeruginosa. Total RNA was extracted from A549 cells immediately (0 time point) or 3 h after addition of P. aeruginosa PAK. Each RNA sample was used as a template for synthesis of cDNA probes, which were incorporated with either Cy3- or Cy5-dCTP. The probes were mixed and hybridized to a microarray slide. The slides were scanned in a dual-laser scanning confocal microscope (Molecular Dynamics). The 0 time point was labeled with Cy3-dCTP (green) and the 3-h sample was labeled with Cy5-dCTP (red).