
Figure 2.
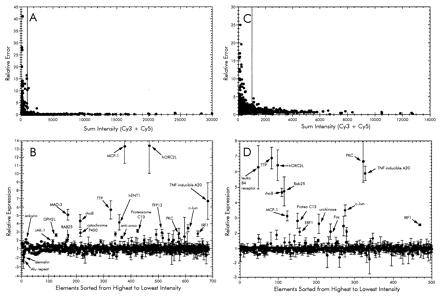
Analysis of microarray data from time-course infection (A and B) and adherence-mediated activation (PAK vs. PAK-NP; C and D) experiments. (A and C) Sum fluorescence intensities of both Cy3 and Cy5 plotted as a function of the relative error of the ratios from each element. The cut-off value for each was set to a sum intensity of 1,000. Those elements showing an intensity value above the cut-off were sorted from highest to lowest intensity and then plotted in the lower graphs (B and D) reflecting the relative ratios of each. The expression ratios in the time-course experiment were calculated such that genes showing increased expression at 3 h have values >1 and those with signals higher in the 0-h sample are less than −1 (B). This was accomplished by calculating the negative inverse of the 3:0 h ratio when the value was <1. Similarly, the expression ratio in the adherence activation was calculated so that increased expression during infection with wild type P. aeruginosa PAK is >1 and PAK-NP is less than −1 (D).