
Figure 3.
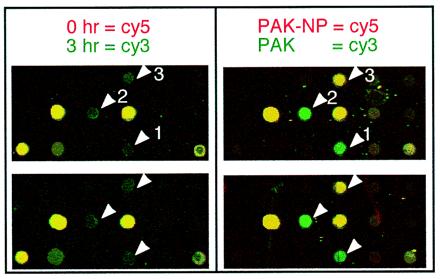
Close-up image of the IRF-1 containing region of microarray. Identical portions from several microarrays used during a time-course infection and an adhesion-dependence experiments are shown. Several genes represented in these images are IRF-1 (arrow 1), c-Jun (arrow 2), and TFPI2 (arrow 3).