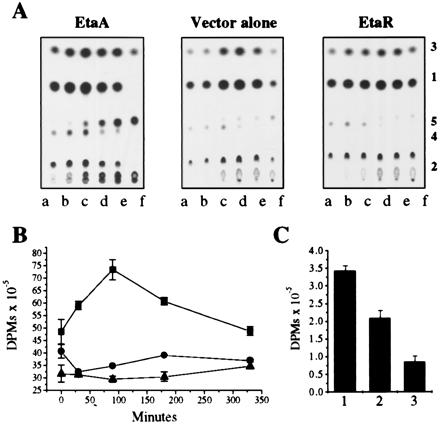
Figure 3.

EtaA and EtaR control ETA metabolism. (A) The MSm clones used in Fig. 2 were analyzed for their ability to metabolize [1-14C]ETA. Lanes a–f correspond to sequential filtered culture samples taken at 0, 30, 90, 180, 330, and 900 min, respectively. Metabolites were identified as in Fig. 1 and labeled accordingly. (B) The cell-associated radioactivity for each sequential clone aliquot (1,000 μl) was determined as in Fig. 1B. ■, MSm overexpressing EtaA; ●, wild-type MSm; ▴, MSm overexpressing EtaR. (C) Macromolecule-associated radioactivity was calculated by resuspending microcentrifuged 900-min aliquots (400 μl) in PBS, bead beating (3 × 45 sec), and extensively dialyzing the total lysates to remove molecules smaller than 10 kDa before scintillation analysis. Column 1, MSm overexpressing EtaA; column 2, wild-type MSm; column 3, MSm overexpressing EtaR.
