Figure 1.

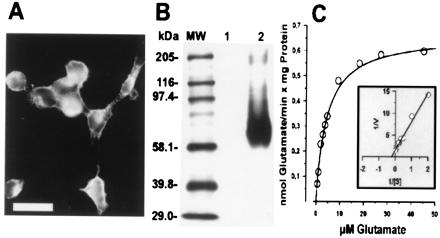
Protein expression and functional characterization of heterologously expressed EAAC1 in HEK293 cells. (A) Fluorescence micrograph of HEKEAAC1 cells immunolabeled for EAAC1. (Bar = 20 μm.) (B) Immunoblot analysis. Aliquots of SDS extracts (5 μg per lane) of membrane protein fractions of cells transfected with vector alone (lane 1) and HEKEAAC1 cells (lane 2) were subjected to SDS/10% polyacrylamide gel electrophoresis and were immunoblotted with EAAC1-specific antibodies (0.04 μg/ml). Molecular mass markers (lane MW) are indicated in kDa. (C) Kinetic properties of l-[3H]glutamate uptake into HEKEAAC1 membrane vesicle preparations. Uptake velocity was measured by using 1 μCi (1 μCi = 37 kBq) of l-[3H]glutamate and increasing concentrations of unlabeled l-glutamate at a membrane vesicle protein concentration of 40 μg. Measurements were taken within the linear range of uptake (15 and 30 s). The data are the mean of triplicate determinations from three experiments. The Km and Vmax values were obtained from the Lineweaver–Burk plot (Inset, n = 3).
