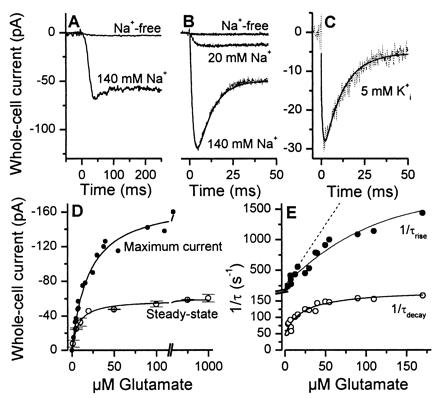
Figure 2.

(A) Typical whole-cell current recording from an HEKEAAC1 cell. Glutamate (100 μM) was applied to the cell by rapid solution exchange in the absence (upper trace) and presence (lower trace) of 140 mM extracellular Na+ [V = 0 mV, KSCN-based intracellular solution, Na+ replaced by N-methyl-d-glucamine (NMG+)]. In this, and the following figures showing experiments in the absence of dl-threo-β-benzyloxyaspartate (TBOA) the leak current was subtracted. (B) Laser-pulse experiment with the same cell as in A at extracellular Na+ concentrations of 0, 20, and 140 mM. Glutamate was released from 500 μM α-carboxy-o-nitrobenzyl-caged glutamate with a 340-nm laser flash (180 mJ/cm2) at time 0. The solid line represents the best fit to the data according to the equation I(t) = −I∞ + Imaxexp(−t/τrise) − (Imax − I∞)exp(−t/τdecay). I represents current at times t (I(t)), t = ∞ (I∞), and at the maximum of the response (Imax). The time constants for the rise and the decay of the current were τrise = 1.9 ± 0.1 ms and τdecay = 8.0 ± 0.1 ms, respectively. The concentration of photolytically released glutamate was 45 ± 10 μM. (C) Similar laser-pulse experiment, but in the presence of only 5 mM intracellular K+ (K+ was replaced by NMG+, the intracellular anion was NO3−). The time constant τdecay was 9.8 ± 0.6 ms (fit shown as solid line). (D) The steady-state (○, rapid solution exchange) and maximum (●, laser-pulse photolysis) current is shown as a function of glutamate concentration (V = 0 mV, n = 4, error bars indicate ± SD). The line represents the best fit according to I = Imax(L/(L + Kapp))n (see text). (E) Glutamate concentration dependence of 1/τdecay (○) and 1/τrise (●) (V = 0 mV, four different cells). The lines represent the best fits according to Eqs. 2A and 2B (kop = 1400 s−1 and kcl = 630 s−1; see Results for the other parameters). The broken line represents a simulation of a simple bimolecular glutamate:transporter binding reaction with a slope of kd = 2⋅107 M−1⋅s−1 and k−d = 250 s−1.
