
FIG. 1.
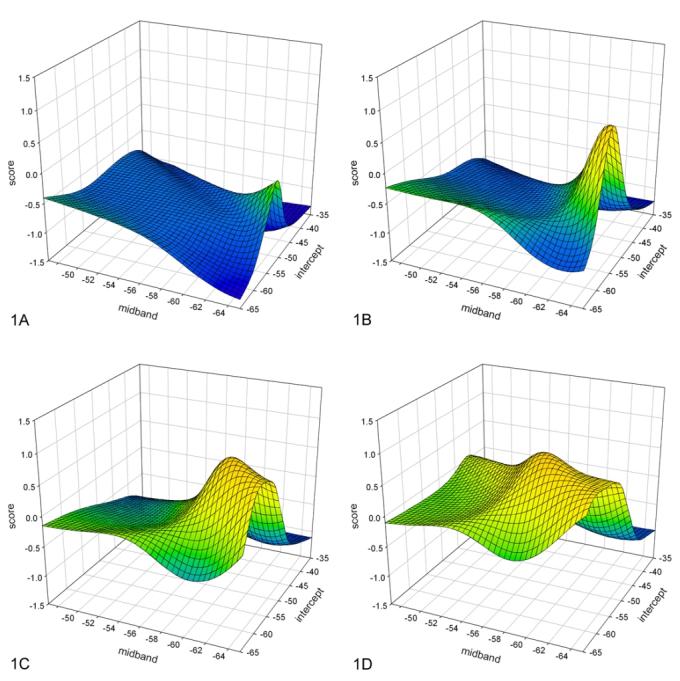
Lookup-table examples for different PSA values. A. Lookup table for PSA = 1; B. Lookup table for PSA = 8; C. Lookup table for PSA = 15; D. Lookup table for PSA = 22. The vertical axis is the score value (cancer likeli-hood) increasing toward the top; the lower axis is the midband value decreasing to the right; the right axis is the in tercept value decreasing toward the front. Note the distinct peak in score values at low midband and intercept values for low PSA values, and an increase in overall score value along with a shift of the peak scores to more-positive (higher) midband values as PSA value in creases.