
FIG. 3.
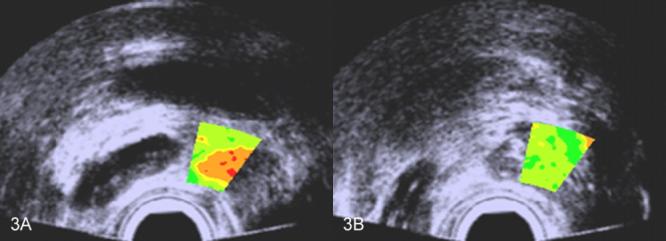
Scans with TTIs of one patient's prostate showing color encoding in a window that might be optimal for biopsy guidance. A. TTI for which the corresponding biopsy was positive; B. TTI for which the corresponding biopsy was negative. The false colors are superimposed on a midband image: green and yellow-green indicate lower cancer likelihoods; orange and red indicate higher cancer likelihoods.