
Figure 4.
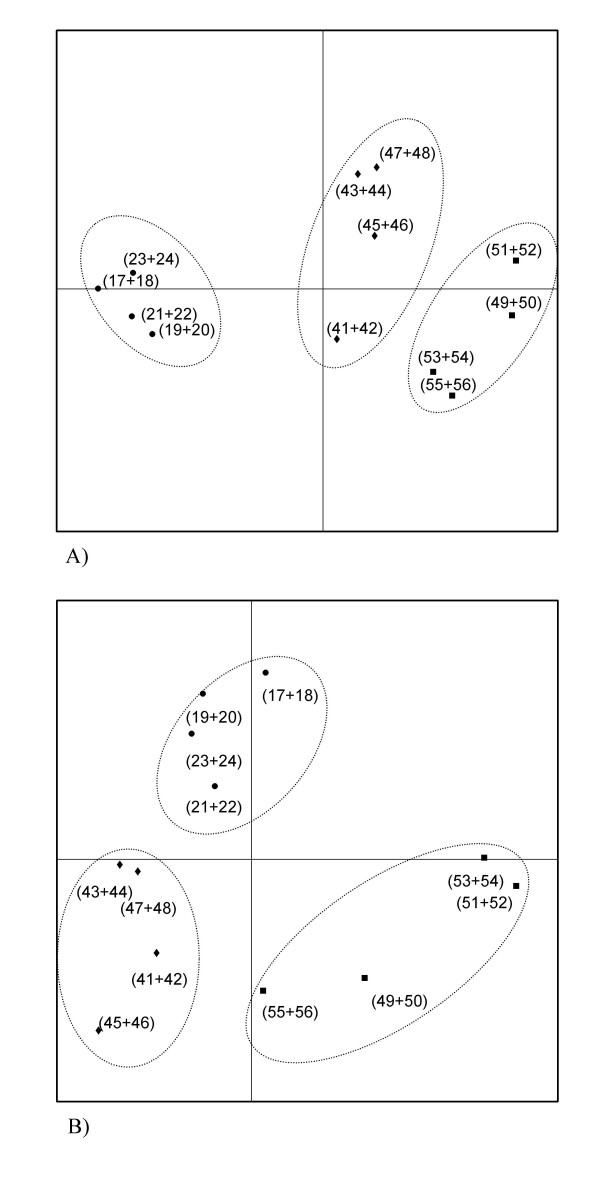
Score plots from Principal Component Analysis of DGGE profiles based on bacterial DNA (A) and RNA (B) extracted from faecal samples. Dotted lines encircles groups fed with control (black dots), inulin (diamonds) and oligofructose (squares) diets. Animal numbers (Table) representing each point are given in parentheses. A) The amount of variability accounted for by Factor 1 is 30.4% and by Factor 2 is 14.1%. B) The amount of variability accounted for by Factor 1 is 19.4% and by Factor 2 is 16.7%