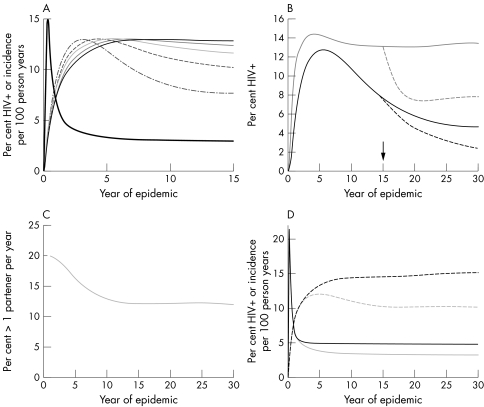
Figure 1 Natural dynamics of generalised HIV epidemic. (A) Predicted HIV incidence per 100 person years at risk (thick black line) and HIV prevalence among women for varying periods from infection to death. For 25 year olds mean interval from infection until death is 11 years (thin black line), 9 years (dark grey line), 7 years (light grey line), 5 year (dashed line), and 3 years (dotted/dashed line). (B) HIV prevalence among women aged 20–24 years (grey lines) and 30–35 years (black lines) without behaviour change (solid lines) and with the transmission probability halving at year 15 (dashed lines). (C) The proportion of men and women currently forming more than one sexual partnership per year. (D) Predicted HIV incidence per 100 person years at risk (solid lines) and HIV prevalence among women (dashed lines) with the relative size of sexual activity groups being allowed to change freely (grey lines) and being held constant with recruitment to the high activity groups from lower activity groups (black lines).

An official website of the United States government
Here's how you know
Official websites use .gov
A
.gov website belongs to an official
government organization in the United States.
Secure .gov websites use HTTPS
A lock (
) or https:// means you've safely
connected to the .gov website. Share sensitive
information only on official, secure websites.
