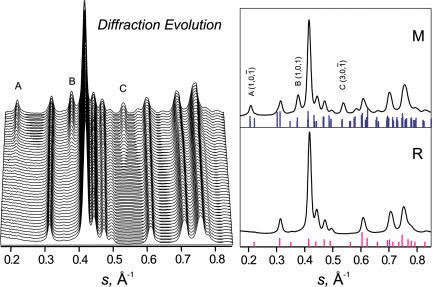
Fig. 4.
Diffraction evolution through the phase transition. The evolution was observed by ramping either the temperature of the sample or the average power. Shown here are the characteristic changes in the diffraction peaks as the system undergoes the transition from the rutile structure to the monoclinic structure. (Left) Of particular interest are the peaks labeled A, B, and C, which characterize the monoclinic phase. (Right) The diffraction peaks together with the theoretical assignments indicated by the bars.

