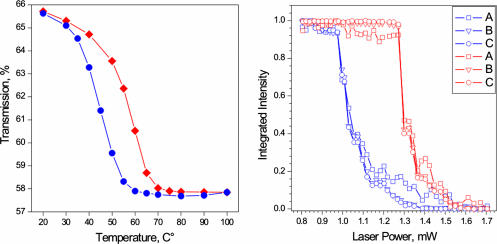
Fig. 5.
Phase transition hysteresis. The reported behavior was from experiments varying the temperature of the sample at steady state (Left) and varying the average power (Right). The transmission was measured in a window between 1,300 and 1,400 nm. The phase transition occurs in the range of 55°C (forward ramp) and at ≈1.2 mW of average power. We note that, at a given temperature (e.g., 45°C), the structures allowed are determined by the vertical positions between blue and red curves.

