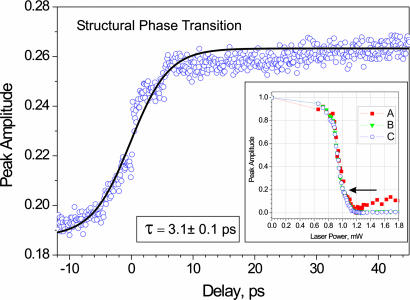
Fig. 6.
Observed ultrafast structural phase transition by UEM. The time scale was scanned from −15 to +45 ps and with steps of 100 fs. The rise with the best fit (3.1 ± 0.1 ps) represents the increase in the contribution percentage of the monoclinic structure at the temperature around the middle of the phase change (indicated by the arrow in Inset). When the rise was fit over a shorter range to highlight the step at longer time, the rise time became 2.1 ps. When the experiments were repeated between −150 ps and +1.15 ns with steps of 5 ps, we observed the same change but the rise was within a single step.

