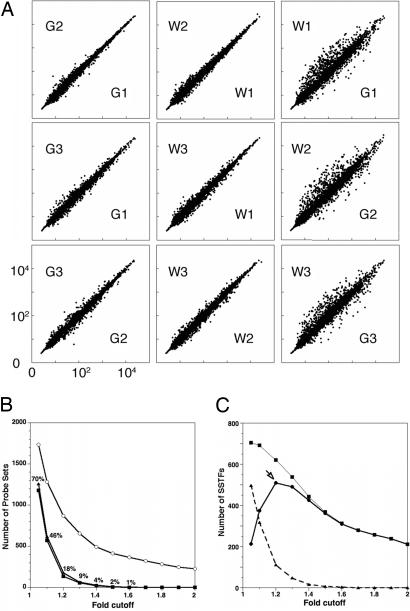
Fig. 2.
False-positive rates and network size. (A) Single-array comparisons of 3,108 probe sets corresponding to 1,567 SSTFs. Six Affymetrix mouse 430 arrays were exposed to probes from independent RNA isolates. Three probes (G1, G2, and G3) were obtained from GFP+ cells, and three probes (W1, W2, and W3) were obtained from GFP− cells. GCRMA normalized intensities for each SSTF probe set are plotted against each other for different pairings of arrays. (B) The number of probe sets with changes above each fold cutoff in three internal (filled) or in three cross-(open) comparisons. Internal comparisons were among W1–W3 arrays (triangles) or among G1–G3 arrays (squares). Cross-comparisons were between G and W arrays (circles). The plotted values are averages from all 84 permutations of three cross-comparisons. The number of differences in internal comparisons was divided by the number of differences in cross-comparisons to compute the false-positive rates (percentages shown at each fold cutoff). (C) The total number of SSTF genes with significant differences (95% confidence by t test) between the averaged green and averaged white signals is plotted at different fold cutoffs (squares). The false-positive rates from B were used to calculate how many these significant differences were expected to be correct (circles) or incorrect (triangles). The maximum number of correct differences was 510 at the 1.2-fold cutoff. This is the minimum network size.

