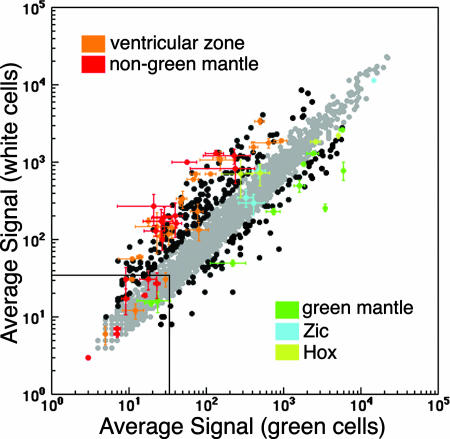
Fig. 3.
Identification of new active nodes by using properties of known SSTFs as constraints. The averages signal intensities of three microarrays were plotted against each other. Probe sets of known genes (SI Table 1) were color-coded by their known expression (orange, ventricular zone; red, mantle zone outside Lbx1-expressing populations; green, mantle zone in Lbx1-expressing populations; cyan, Zics 1, 2, 4, and 5; olive Hox genes b6, b8, c8, d9, and d10; see SI Table 1 for more details) and plotted with all other SSTF probe sets (black or gray). Error bars indicate the SD in the three replicates in each dimension and are only shown for knowns. Probe sets which exhibit a ≥2-fold change are indicated in black, whereas those that have fold changes below that threshold are indicated in gray. Two-fold change and >33 intensity thresholds accommodate the vast majority of known genes and can be used to identify SSTFs that change as much as the knowns. These are listed in SI Tables 2 and 3.

