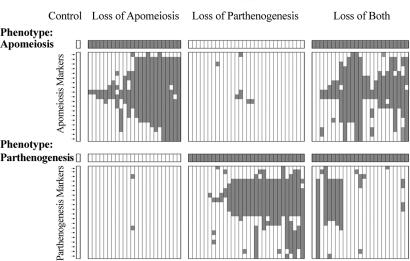
Fig. 2.
AFLP markers in a selection of 81 mutants in which apomeiosis and/or parthenogenesis was dysfunctional. Vertical columns represent mutants, horizontal rows represent markers, a light square represents a marker that is present, and a dark square represents a marker that is absent. Phenotypic data are shown in the bar at the top of each group. The controls were subjected to irradiation and regeneration, but they did not express a mutant phenotype with respect to apomixis.

