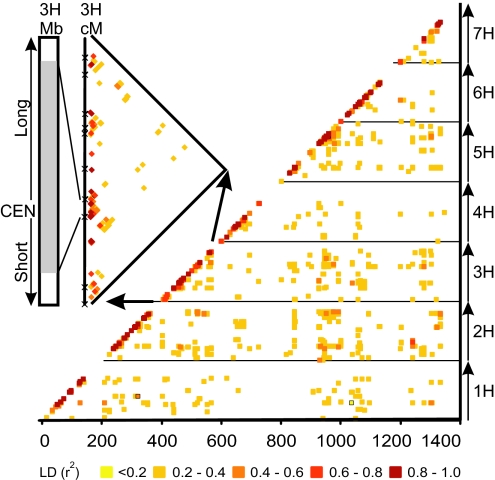
Fig. 3.
LD matrix of European two-row spring barley. Data points are colored by magnitude of LD (r2). LD is plotted along the cumulative linkage map of the barley genome with chromosome starting at multiples of 200 cM. (Inset) Variation in LD along the barley chromosome 3H, which correlates with the recombination (genetic distance) and physical map of centromeric region of 3H (23). BIN 6 of the linkage map encompasses ≈600 Mb of chromosome 3H including the centromere (CEN) (23, 24), and r2 exhibits strong LD across the whole region.

