Fig. 4.
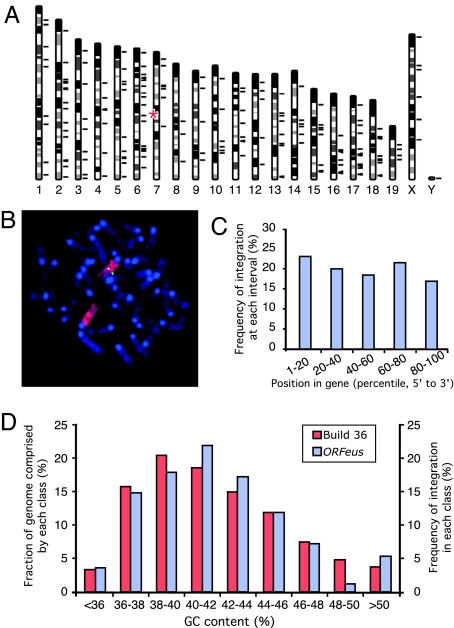
Chromosomal distribution of mapped insertions. (A) A total of 171 mappable insertions were charted to mouse genome build 36 (short black lines to the right of individual chromosomes). The approximate position of donor concatemer on chromosome 7 is marked (red asterisks). The Y chromosome insertion was mapped to multiple Y chromosome-specific BAC clones. (B) Mapping donor transgene location by FISH. Metaphase spreads of splenocytes from donor-containing mice were probed with fluorescently labeled full-length transgene cDNA probe (green) and subsequently with a whole-chromosome paint probe for chromosome 7 (red). Chromosomes were counterstained with DAPI (blue). (C) Distribution of insertions within annotated genes. The point of integration for every intragenic insertion (a total of 65) was transformed into a percentile value relative to the gene length (from 5′ to 3′) and binned into five-percentile intervals (x axis). Integration frequency was derived by dividing the number of intragenic insertions in each interval by the total number of intragenic insertions (y axis). (D) Distribution of ORFeus insertions relative to local GC content. GC content was determined for a 50-kb region centered at each insertion, and the frequency of integration was plotted as a function of the local GC content (right y axis); as a comparison, the mouse genome was binned as 50-kb segments by guanine-cytosine (GC) content (left y axis).

