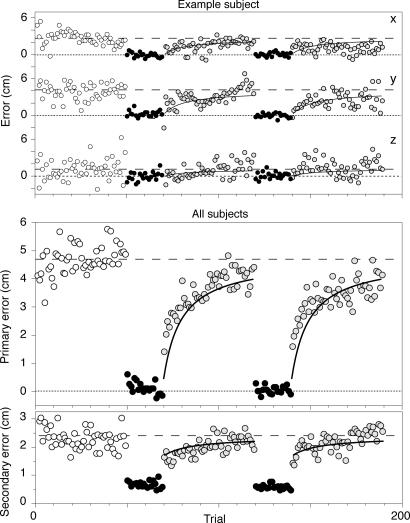
Fig. 3.
The error in the hand's end position during the five consecutive blocks of trials. White disks, trials in the first test block in which the subjects only saw the target cube. Black disks, trials in the feedback blocks in which subjects saw both the target cube and the cube in their hand. Yellow disks, trials in the test blocks after a feedback block. The continuous curves are the model predictions based on the bias and variable error in the first two blocks (they are identical for the third and fifth blocks). (Upper) The three orthogonal components of the error during a typical session. (Lower) The primary and secondary error averaged over the two repetitions of all 10 subjects.

