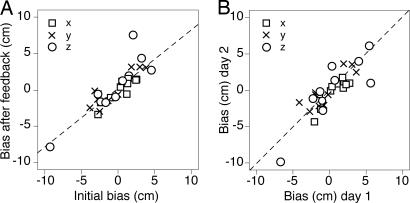
Fig. 4.
The bias (systematic error) in individual subjects' performance in three orthogonal directions (x, horizontal; y, vertical; z, depth). Dashed lines indicate model predictions. (A) The error in the second half of the third and fifth blocks compared with the error in the first block. The model (Eq. 4) predicts a slope of 0.79. (B) The error in the second half of the blocks without feedback on the 2nd day compared with that on the 1st day. The model predicts equal errors (unity slope).

