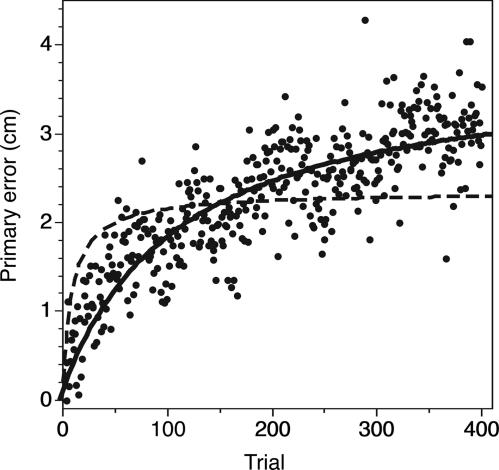
Fig. 6.
The primary error in the experiment of de Grave et al. (15). The black dots are the measured errors (averaged over all subjects). The model (4) can fit these data well if we use the measured variances to calculate the speed of drift (continuous curve). If we assume that the drift speed is the same as in the present experiment (Fig. 4), the best fit (dashed curve) does not follow the data very well.

