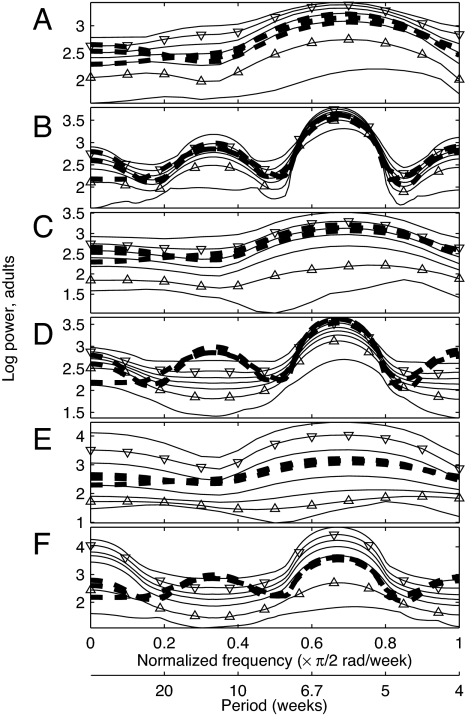
Fig. 2.
Frequency domain fits between models and observed adult population time series of length 41 (A, C, and E) and length 213 (B, D, and F) from the three experimental replicates with cpa = 0.35. The heavy dashed lines are data log spectra, identical in A, C, and E and identical in B, D, and F. Light solid lines give the minimum, the 5th, 25th, 50th, 75th, and 95th percentiles, and the maximum values at each frequency value of 1,000 log spectra of model-generated time series of length 41 (A, C, and E) and length 213 (B, D, and F). Triangles highlight the 5th and 95th percentiles. Models used were the LSD-LPA model with parameters of Supporting Text 1.1 (A and B), the (intentionally incorrect) constrained LSD-LPA model with cel = 0 and time-domain-optimized parameters of Supporting Text 2.2 (C and D), and the (intentionally incorrect) constrained LSD-LPA model with cea = 0 and time-domain-optimized parameters of Supporting Text 2.2 (E and F). All parameters were optimized for length-41 data. Contrast the good fit in B with the poor fits in D and F. Fit of the constrained LSD-LPA model with no further constraint is similar to A and B and is shown in Supporting Text 2.2. Fits were similar when frequency-domain optimized parameters were used (Supporting Text 2.2). Aliasing of fundamental frequencies of population fluctuation is unlikely to have occurred because the biology of Tribolium suggests that little fluctuation occurs for normalized frequency (nf) >1.

