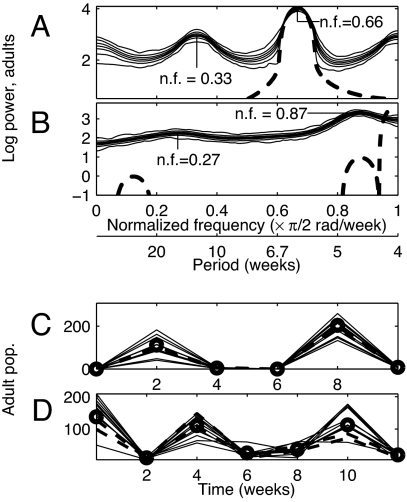
Fig. 3.
Model-predicted power spectra (A and B) and experimental support for predictions (C and D). LSD-LPA model-predicted peaks for cpa = 0.5 (A) and cpa = 0 (B) correspond to period 6 time steps (nf 0.33) (A) and period ≈7.4 time steps (nf 0.27) (B). Thin solid lines in A and B give the minimum, 5th, 25th, 50th, 75th, and 95th percentiles, and maximum values at each frequency of 1,000 log spectra of LSD-LPA model-generated adult time series of length 1024. Thick dashed lines give spectra of time series generated by the LPA model with initial conditions on the model attractor. Dashed lines extend below figure axes, but show no important features there. (C) Thin solid lines give 10 repetitions of a length-6 repeating pattern randomly chosen from 129 repetitions isolated from typical length-1024 output of the LSD-LPA model with cpa = 0.5. Centers of heavy circles are medians of all 129 repetitions. The median pattern was present in experimental data; the best repetition detected in each of the three replicates is shown with a thick dashed line. The pattern caused the smaller LSD-LPA model peak (at nf 0.33) in A. (D) Thin solid lines give 10 repetitions of a length-7 repeating pattern isolated from typical length-1024 output of the LSD-LPA model with cpa = 0. Centers of heavy circles are medians of these values. The median pattern was detected in data (thick dashed lines). The pattern caused the smaller LSD-LPA model peak (at nf 0.27) in B.

