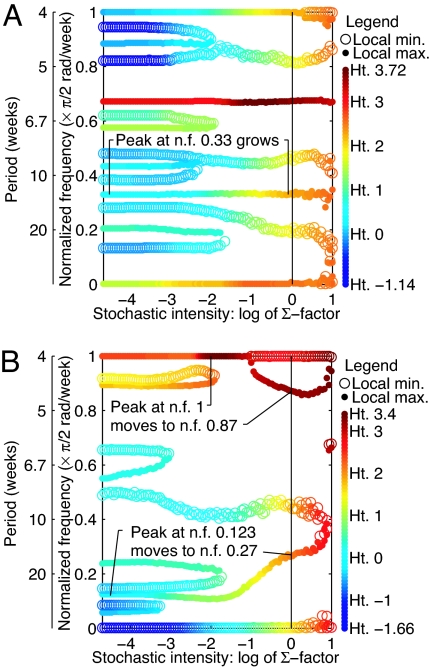
Fig. 4.
Spectral peaks and valleys with increasing intensity of stochasticity in the SD-LPA model for the adult life-stage with cpa = 0.5 (A) and cpa = 0 (B). Vertical axes show frequencies of local maxima (filled circles) and minima (open circles) of log spectra. Color shows the heights (Ht.) of local maxima and minima. Horizontal axis shows intensity of stochasticity (scalar multiple of noise covariance matrix; see Methods). Under very low stochasticity (left), spectra were those of the deterministic model. Vertical black lines show experimental stochasticity (Σ factor 1). For these parameter values and Σ factor 1, LSD-LPA, and SD-LPA model spectral predictions were very similar: lattice effects were small. Stochasticity explains the locations of peaks for the LSD-LPA model (Fig. 3 A and B) by explaining the locations of peaks for the SD-LPA model. The smaller peak in Fig. 3A was induced by stochasticity. The smaller peak of Fig. 3B (nf = 0.27) was the nf = 0.123 peak of the LPA model, shifted by stochasticity (and not further shifted by lattice effects). The main peak of Fig. 3B (nf = 0.87) did not come from the deterministic model peak at nf = 0.877, as was expected before this analysis, but was the nf = 1 deterministic model peak, shifted by stochasticity (and not further changed by lattice effects). The deterministic model peak at nf = 0.877 was eliminated by stochasticity. Supporting Text 2.3 shows other life stages. No statistical confidence intervals are given for the locations or heights of peaks and valleys because the variability in these quantities is expected to be small (Supporting Text 1.6 has details of how plots were produced) and no probabilistic conclusions were drawn.

