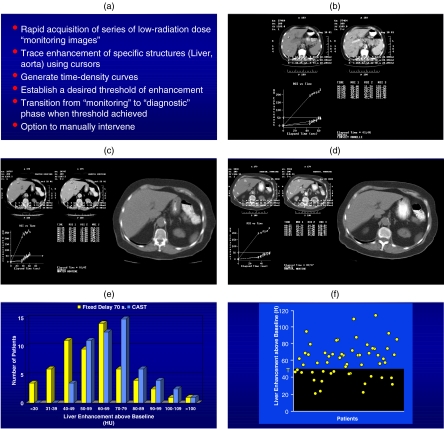
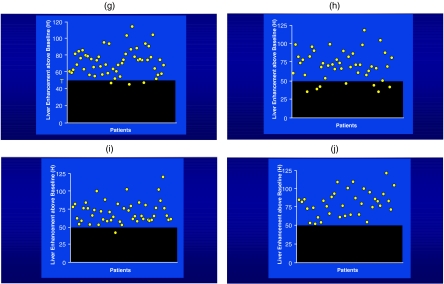
Figure 2.
(a) Computer automated scanning technology (CAST) . (b) Graph showing the aortic and liver enhancement curves with a threshold set of 50 HU for the liver. (c) Graphic demonstrating good contrast enhancement with a rapid rise of liver enhancement to the threshold. (d) Same patient as in (c) except following chemotherapy where the rise of the liver enhancement is attenuated due to the poor clinical status of the patient. (e) Patient distribution showing better liver enhancement overall when CAST technology is used. (f) Graphic demonstration showing the number of patients above and below the threshold of 50 HU of enhancement relatively equally distributed. (g) With the use of CAST, this allows many more patients to have a contrast enhancement greater than 40 HU and, therefore, better liver lesion contrast. (h) The use of a fixed delay with a contrast load of 150 ml (300 mg I /ml) of contrast showing approximately two-thirds of patients above the threshold of 50 HU. (i) When 25 ml less contrast is given, an equivalent quality study can be achieved using CAST. (j) When 150 ml of contrast is used, the contrast enhancement of the liver is optimal with all the patients achieving more than 50 HU of enhancements.


