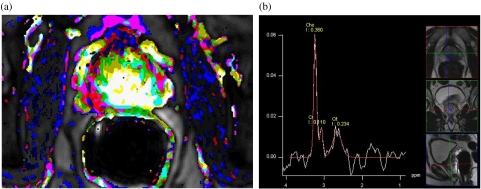
Figure 1.
Prostate cancer. (a) Parameter image of perfusion and permeability with the cancer showing increased values given as light colours representing gross tumour extension at pathology. (b) MR spectroscopy shows elevated choline and decreased citrate and creatine indicating the adenocarcinoma seen as a hypointense area in the T2-weighted planning sequences. This area also corresponds to the area of increased perfusion and permeability (a).

