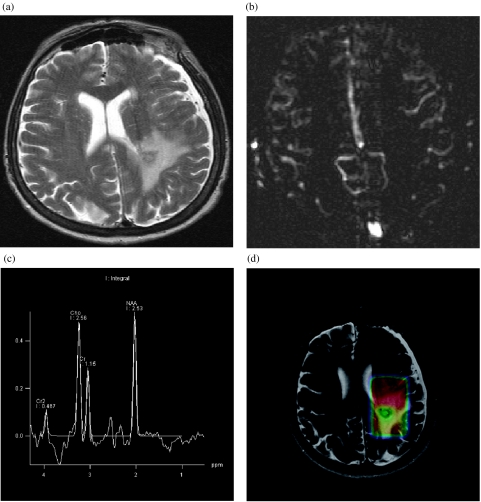
Figure 2.
Anaplastic glioma. (a) T2-weighted turbo-spin-echo image shows the tumour in the left parietal lobe. (b) Perfusion map obtained by arterial spin labelling, a non-contrast technique, shows tumour blood flow not elevated compared to grey matter. (c) Single voxel spectroscopy from tumour tissue shows an increase of Cho indicating increased cellularity and cell membrane synthesis. (d) Colour-coded map of the ratio of N-acetyl-aspartate (NAA)/creatine superimposed on the T2-weighted TSE image shows reduced NAA signal suggesting loss of normal neural elements.

