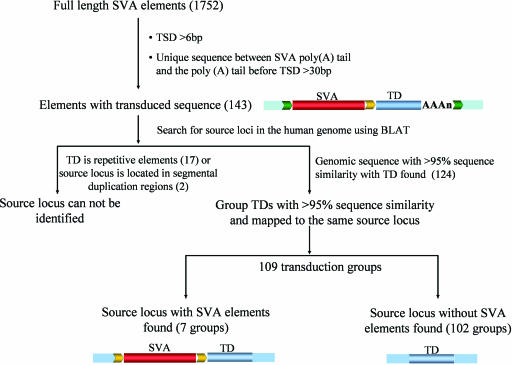
Fig. 1.
Identification of SVA 3′ transduction events and their source elements. Shown are the schematic diagrams for the identification process. Flanking sequences of the source locus are shown as blue boxes; TSDs are shown as yellow and green arrows. SVA elements are depicted as red bars, and the transduced sequences are shown as blue bars and labeled “TD.” SVA element poly(A) tails are shown as “(AAA)n.” The numbers in parentheses correspond to the total number of SVA elements/groups identified in each step.

