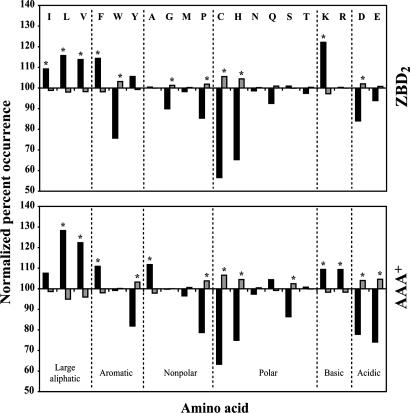
Fig. 1.
Analysis of ZBD- and AAA+-binding preferences using peptide arrays. Shown are the ZBD2 and AAA+ residue-binding preferences. The normalized percent occurrence for each amino acid was determined for both the binder (black bars) and nonbinder (gray bars) groups. Asterisk indicates that the difference between the occurrence of an amino acid in the binder group and on the array is significant at the 95% confidence level using the z test (22).

