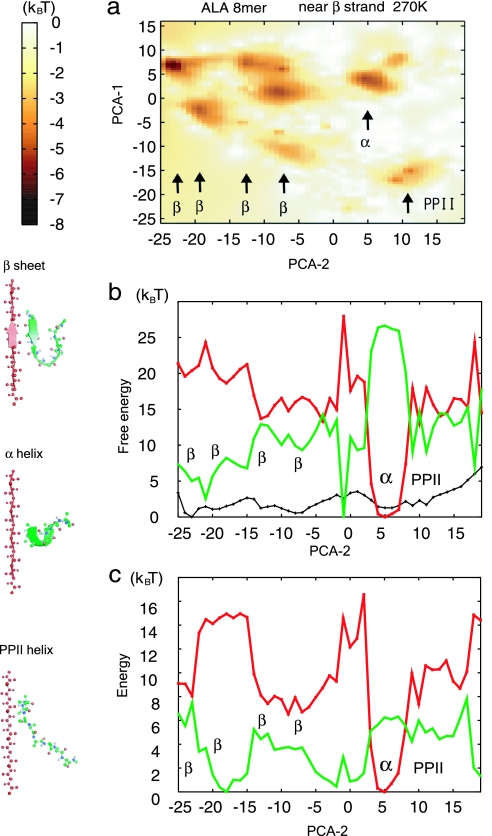
Fig. 4.
Free-energy landscape of Ala8 near the β-strand template with an 8-Å separation (shown in red) at 270 K was calculated by using the GB solvation model. (a) 2D free-energy surface on PC1 (PCA-1; vertical) and PC2 (PCA-2; horizontal) axes. Note that these axes are reversed from those in Figs. 1 and 2. (b) The (relative) free-energy curve F (shown in black), energetic contribution E (shown in red), and entropic contribution −TS (shown in green) are projected on PC2. (c) The energetic contribution in b was further decomposed into vdW energy (shown in red) and electrostatic energy (shown in green).

