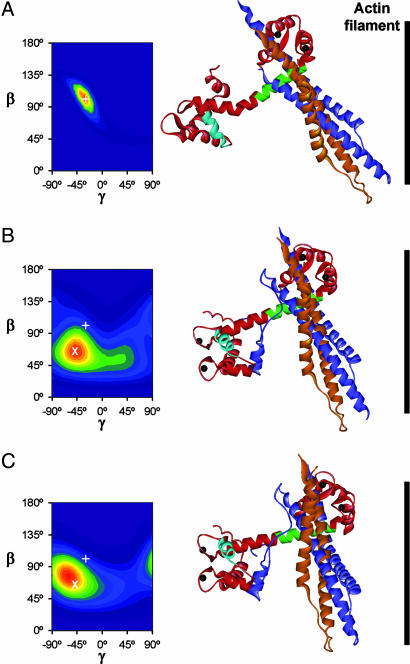
Fig. 4.
In situ conformation of the troponin core complex in relaxation (A), active contraction (B), and rigor at pCa 4.5 (C). Left shows maximum entropy orientation distributions where β denotes the angle between the D helix of TnC and the actin filament axis and γ the twist around this axis. +, peak of distribution in A; X, peak of distribution in B. Molecular graphics show the three peak orientations based on the in vitro structure of the skeletal muscle troponin core complex in the Ca saturated state (Fig. 1), except for the N lobe of TnC in A, which is from ref. 12.

