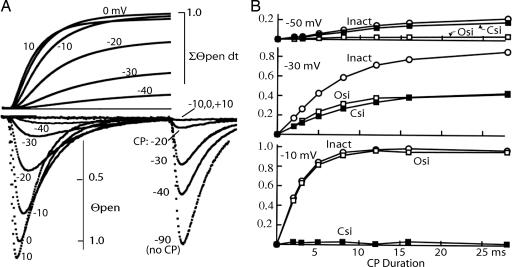
Fig. 2.
Measuring open- and closed-state inactivation. (A Lower) The lower traces show the fraction of Θpen channels (see Methods) for a 16-ms conditioning pulse (CP) to the indicated voltage. The peaks at the right show Θpen at 0 mV after a CP to the indicated voltage (see Fig. 1A for protocol). CP to −10, 0, or +10 mV causes complete inactivation. (A Upper) Time integrals of Θpen during the CP (lower left traces). The integral reaches a maximum in the range −10 to + 10 mV. This maximum is assigned the value 1.0 and is the Θpen-time integral required for all channels to inactivate via the open state. This value is used to calculate Osi and Csi (see Results). (B) Osi, Csi, and total (Inact) inactivation at three voltages as a function of CP duration.

