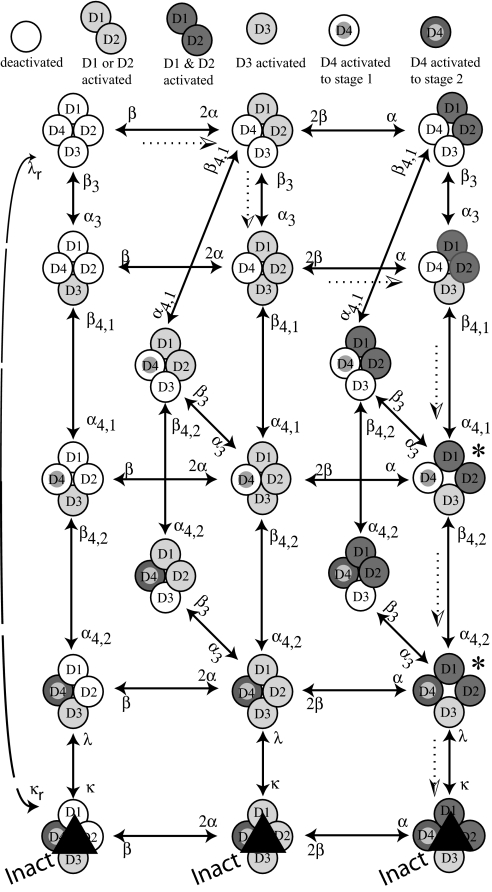
Fig. 4.
State diagram for activation and inactivation. A horizontal step represents activation (rightward movement) or deactivation (leftward movement) of D1 or D2, which are kinetically indistinguishable. A vertical step represents activation/deactivation of D3 (rate constants α3/β3), first-stage activation of D4 (α4,1/β4,1), second-stage activation of D4 (α4,2/β4,2), or closing of the inactivation gate (κ/λ). The dotted arrows indicate the most probable path from fully deactivated (upper left corner) to inactivated at 0 mV. Conducting states are marked with asterisks.

