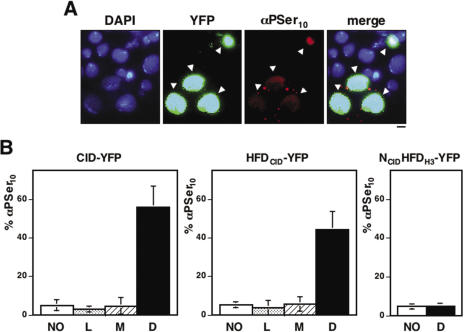
Figure 5.
Cell cycle progression is altered in cells showing mislocalized CID-YFP. (A) Cells were stained with αPSer10 48 h after transfection of CID-YFP. YFP is shown in green. αPSer10 is shown in red. DAPI-staining is shown in blue. Bar corresponds to 5 μm. (B) The percentage of cells that 48 h after transfection of CID-YFP, HFDCID-YFP and NCIDHFDH3-YFP are positive to αPSer10 are presented as a function of the pattern of localization: untransfected cells (white columns); cells showing CID-YFP localized exclusively at centromeres (dotted columns); cells showing mislocalized CID-YFP (black columns) and cells showing CID-YFP at centromeres and throughout chromatin (dashed columns). Results are the average of three independent experiments.

