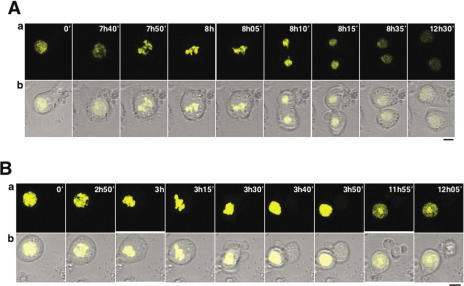
Figure 6.
Cells showing a mixed pattern of CID-YFP localization, at centromeres and throughout chromatin, progress normally through mitosis. Time-lapse analysis of cells showing mislocalized CID-YFP (B) or a mixed pattern of CID-YFP localization (A) are presented as a function of increasing time of visualization. YFP is shown in yellow (a) and merged to transmission (b). Bars correspond to 5 μm.

