
Figure 1.
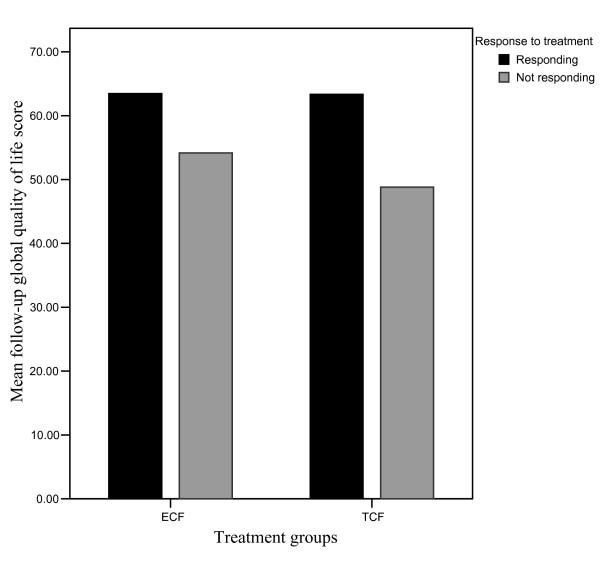
Follow-up global quality of life scores in responding and not responding patients for each treatment group (Higher values show better global quality of life): ECF: Mean score (SD); Responding 63.5 (14.2), Not responding 54.2 (14.9). TCF: Mean score (SD); Responding 63.3 (16.6), Not responding 48.8 (13.5).