
Figure 6.
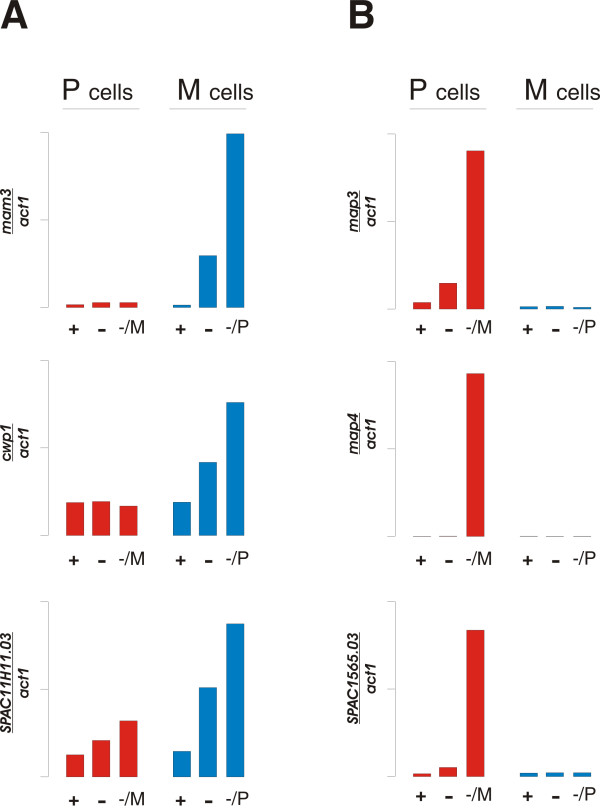
Expression of cell-type specific genes. The expression relative to act1 was monitored by real time PCR under different growth conditions as described in Figure 4. A. M-specific genes: mam3 (upper panel), cwp1 (middle panel) and SPAC11H11.03 (lower panel). B. P-specific genes: map3 (upper panel), map4 (middle panel) and SPAC1565.03 (lower panel).