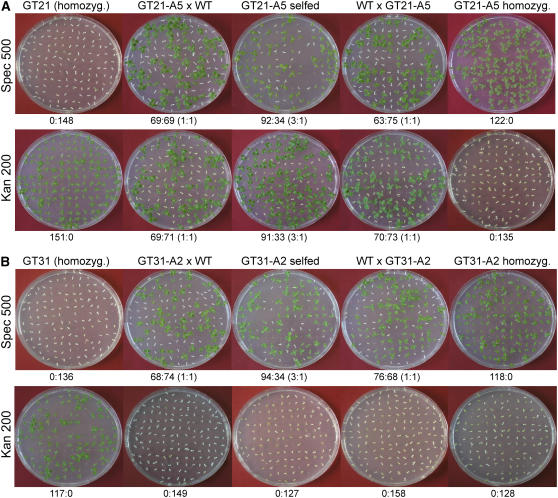
Figure 2.
Analysis of the Inheritance of the Resistance to Spectinomycin and Kanamycin in Lines Selected for Functional Activation of the aadA Gene Transferred from the Chloroplast Genome to the Nucleus.
Crosses are denoted at the top, the antibiotic is indicated at the left (concentration in mg/L), and the segregation data are given below each row.
(A) Segregation data for line Nt-GT21-A5 selected from the homozygous gene transfer plant Nt-GT21 (Table 1).
(B) Segregation data for line Nt-GT31-A2 selected from the heterozygous gene transfer plant Nt-GT31 (Table 1). Note that this line, as it was selected from a heterozygous plant, produced progeny that was uniformly sensitive to kanamycin in all crosses.

