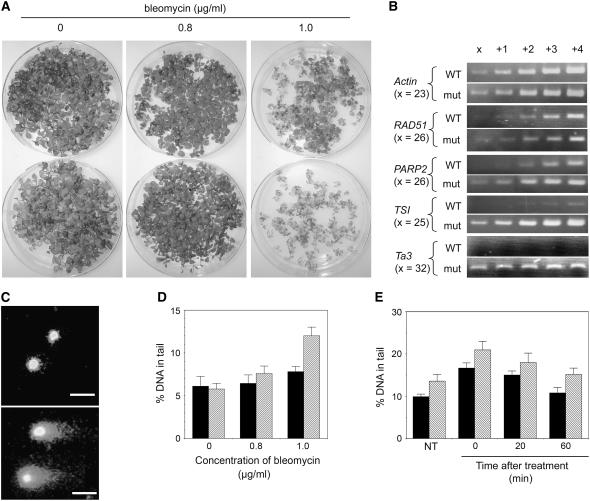
Figure 7.
Response to Bleomycin, DNA Damage, and Release of Gene Silencing in the Double nrp1-1 nrp2-1 Mutant.
(A) Plant growth in the culture medium containing different concentrations of bleomycin. The top plates contain wild-type plants, and the bottom plates contain the mutant plants. Images were taken at 21 DAG.
(B) Semiquantitative RT-PCR analysis of gene expression in the wild-type and the mutant (mut) plants grown with 1.0 μg/mL bleomycin. The increasing number of PCR cycles is given on top of lanes, and the basal number of cycles (x) is given for each gene at the left of the panels.
(C) Representative examples of nuclei seen in the comet assay from the wild-type (top panel) and the mutant (bottom panel) plants grown with 1.0 μg/mL bleomycin.
(D) Levels of DNA damage as measured by the percentage of DNA in the tail of comet in the comet assay for the wild-type (black bars) and the mutant (gray bars) plants grown at different concentrations of bleomycin.
(E) Time course of DNA repair after a 1-h bleomycin treatment in the wild-type (black bars) and the mutant (gray bars) plants. NT, not treated with bleomycin. Each column in (D) and (E) represents the mean value together with the standard deviation bar from three independent experiments in which 200 comets on four gels were evaluated.

