Figure 2.
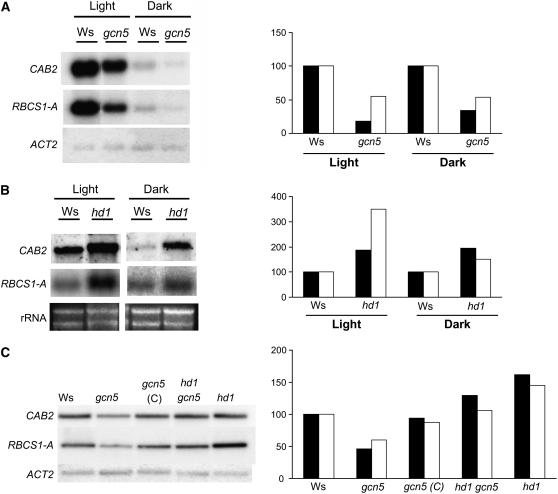
The gcn5 and hd1 Mutations Have Opposite Effects on Light-Inducible Gene Expression.
(A) RNA gel analysis of CAB2 and RBCS-1A gene expression in both light- and dark-grown gcn5 and Ws seedlings. Actin mRNA levels were analyzed to normalize gel loading.
(B) RNA gel analysis of CAB2 and RBCS-1A gene expression in both light- and dark-grown hd1 and Ws seedlings. rRNA transferred to the membranes was used to normalize gel loading.
(C) RNA gel analysis of CAB2 and RBCS-1A gene expression in light-grown Ws, gcn5, gcn5 complemented (C), the gcn5-2 hd1 double mutant, and hd1 seedlings.
Signal quantifications relative to the wild type (arbitrarily given as 100) are presented at right of the gels. Black bars, RBCS-1A; white bars, CAB2.

