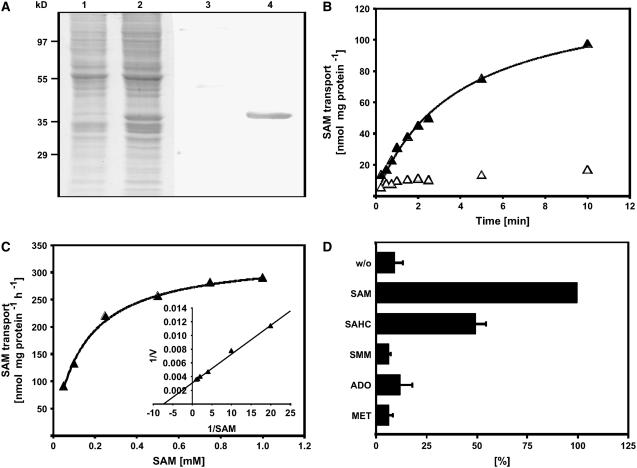
Figure 3.
Expression of SAMT1 in Transgenic Cells, and Determination of Apparent Km and Substrate Specificity of Recombinant SAMT1.
(A) Coomassie blue–stained SDS-PAGE gel showing the total membrane fraction of yeast cells transformed with either the empty expression vector (lane 1) or the expression vector harboring the cDNA encoding SAMT1 (lane 2), and protein gel blot of an identical gel (lanes 3 and 4). Control cells and expression lines were processed in parallel, including induction of expression by the addition of galactose. After transfer of proteins from the gel to a membrane, the proteins were immunodecorated using an anti-penta-His antibody. Lanes 1 and 3, control cells; lanes 2 and 4, yeast line expressing SAMT1.
(B) Time kinetics of SAM transport into liposomes reconstituted with SAMT1. Uptake of SAM into liposomes that had been reconstituted with SAMT1 and preloaded with 20 mM SAM was induced by the addition of radiolabeled SAM to the liposome suspension. Aliquots were removed after 20, 30, 40, 60, 80, 120, 140, 300, and 600 s, and the transport reaction was terminated by loading the liposome suspension onto ion-exchange columns. SAM transport was quantified by liquid scintillation counting of the column pass-through. Open symbols and closed symbols refer to liposomes reconstituted with membranes from control cells and cells expressing SAMT1, respectively.
(C) Determination of the apparent Km value of SAMT1. Rates of SAM uptake into liposomes preloaded with 20 mM SAM were quantified independent of various external SAM concentrations. The inset shows a double-reciprocal plot of the data (Lineweaver-Burk plot) that was used to determine the apparent Km value of SAMT1 for SAM transport. Results from one representative experiment of five independent replicates are shown. The apparent Vmax observed in the experiment shown was 357 nmol SAM·mg−1 protein·h−1.
(D) Substrate specificity of SAMT1. The substrate specificity of SAMT1 was determined by quantifying the rate of SAM transport into liposomes that had been preloaded with 20 mM SAM, SAHC, SMM, adenosine, Met, or control substrate (gluconate). SAM transport was quantified as described for (B). The data shown are arithmetic means ± sd from five independent replicates. ADO, adenosine; w/o, control (i.e., without internal substrates).

