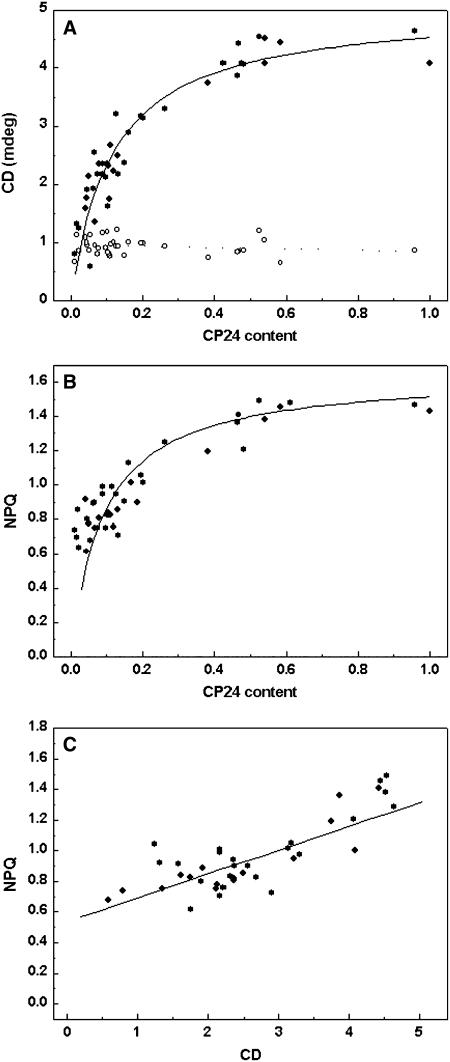
Figure 5.
Relationship between Lhcb6 Protein Content and Spectroscopic Parameters of Thylakoid Structure and Function in asLhcb6 Plants.
(A) Amplitude of CD bands at 690 nm (closed circles) and 448 nm (open circles) obtained from the spectra recorded in Figure 4, normalized to the amplitude of the (−)653-nm band and the relative CP24 content, assessed from densitometry of protein gel blots as shown in Figure 1 and normalized to the maximum amount (= 1).
(B) Value of reversible NPQ (qE) obtained as in Figure 7 and the CP24 content.
(C) Correlation between NPQ obtained as in Figure 7 and amplitude of CD obtained as in Figure 4.

