Figure 5.
Proteomic Analysis of GS1-Deficient Mutants.
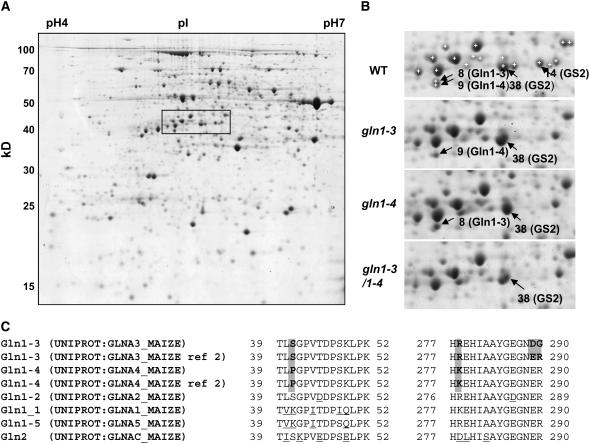
(A) Two-dimensional gel of proteins extracted from the leaves of the wild type. The rectangle shows the region containing GS spots that is enlarged in (B).
(B) Identification of GS1-3, GS1-4, and GS2 proteins in the wild type and in gln1-3, gln1-4, and gln1-3 gln1-4. White crosses with no black arrowheads in the wild type show the spots that were analyzed by LC-MS/MS but did not contain a GS protein.
(C) Sequence of the peptides that allowed the distinction between GS1-3 and GS1-4. Entry names of the sequence in the UNIPROT Database are given. Ref 2 of GS1-3 and GS1-4 refers to the allelic form sequenced by Sakakibara et al. (1992). Positions are relative to the first Met for all GS except for GS2, where it is relative to the first amino acid after the signal peptide. Shaded background shows the differences between GS1-3 and GS1-4 and between GS1-3 allelic forms. Differences between GS1-3 and GS1-4 and the rest of GS proteins are underlined.

