Figure 6.
Biotrophic Development of Δfer2 Strains and Localization of the Fer2:eGFP Fusion Protein.
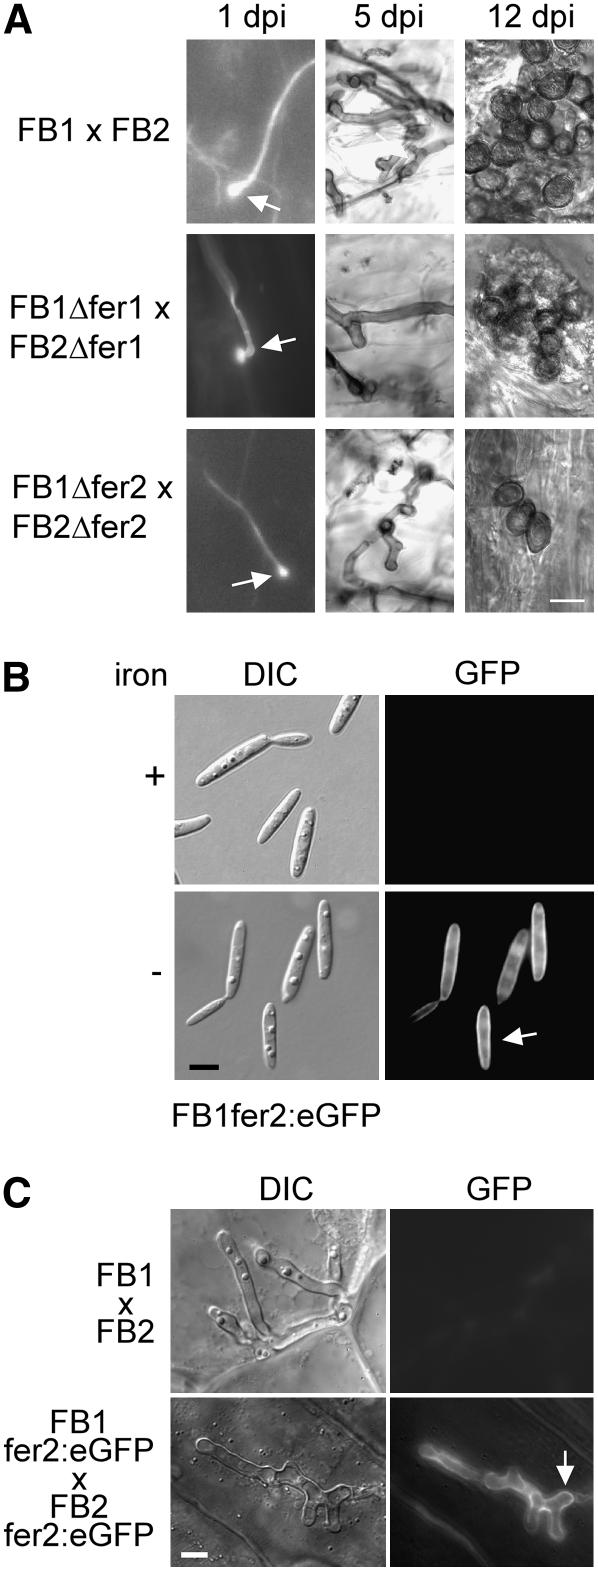
(A) Δfer1 and Δfer2 strains penetrate but show limited growth and rare spore formation. Plants were infected with a mixture of wild-type strains (FB1 × FB2), a mixture of fer1 deletion strains (FB1Δfer1 × FB2Δfer1), or a mixture of fer2 deletion strains (FB1Δfer2 × FB2Δfer2). Fungal structures were observed at 1, 5, and 12 d after infection (dpi) after staining with calcofluor and visualization with fluorescence microscopy (left panels), after staining with Chlorazole black E (middle panels), or without staining (right panels) and visualization by light microscopy (middle and right panels). At 1 d after infection, appressoria (arrows) were observed for all strain combinations (left panels). The sample showing an appressorium of the Δfer1 deletion strains was treated with chloroform before calcofluor staining. At 5 d after infection, fewer mycelial structures were observed in infections with fer1 and fer2 deletion strains than in infections using wild-type strains (middle panels). At 12 d after infection, fully melanized spores were readily observed in infections using wild-type strains but were rarely found in infections using fer1 or fer2 deletion strains (right panels). Bar = 10 μm for all panels.
(B) The Fer2:eGFP fusion protein is expressed under low-iron conditions and localizes to the plasma membrane. The U. maydis strain FB1fer2:eGFP was grown in minimal medium (Sundström, 1964) in the absence or presence of 10 μM FeSO4 (iron). Light microscopy images are shown in the left panel (differential interference contrast [DIC]), and fluorescence images are depicted at right (GFP). Bar = 5 μm.
(C) The Fer2:eGFP fusion protein is expressed at a specific stage during biotrophic growth. Plants were infected with a combination of wild-type strains (FB1 × FB2) or strains carrying the fer2:egfp fusion (FB1fer2:eGFP × FB2fer2:eGFP). Fungal hyphae within the plant tissue were visualized at 6 d after infection by light microscopy (differential interference contrast [DIC]; left panels) or by epifluorescence (GFP; right panels). Bar = 5 μm.

