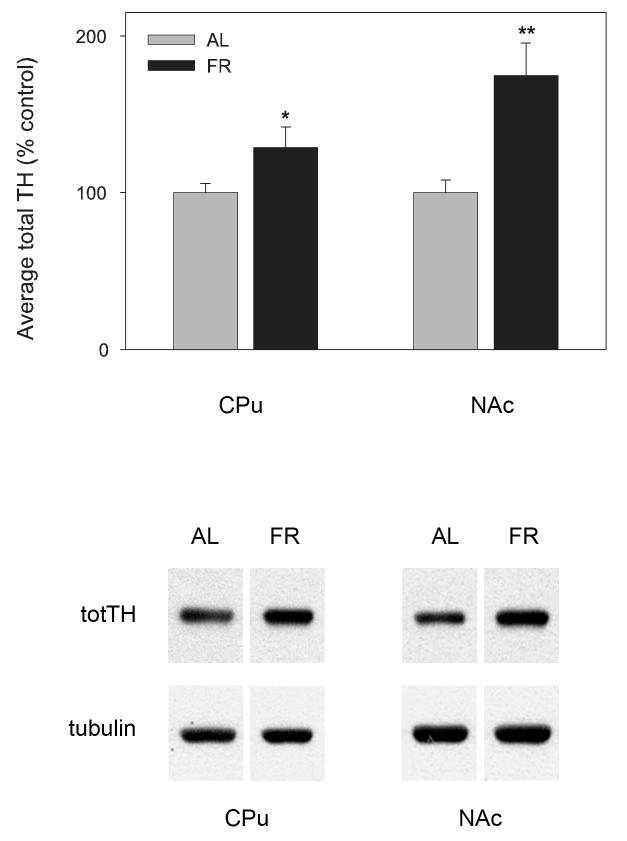
Figure 4.
Mean ± SEM (n = 11 per group) ratio of total tyrosine hydroxylase protein/tubulin in caudate-putamen (CPu) and nucleus accumbens (NAc) of food-restricted (FR) rats determined by Western blot and expressed in comparison to the normalized control ad libitum (AL) fed group. Graphed results are displayed with representative immunoblots. *p=.05; **p=.001

