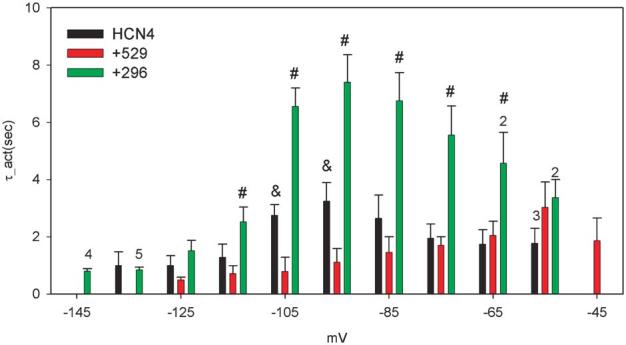
FIGURE 3.

Activation kinetics of HCN4, HCN4+Src529, and HCN4+Src296. Activation kinetics were obtained by fitting the onset current traces to 30 or 40 s. Averaged kinetics data are presented from 8 cells expressing HCN4 and HCN4+Src529 and 10 cells expressing HCN4+296. Numbers above the bars indicate the number of cells analyzed at those potentials. #P <0.05 for HCN4 and HCN4+Src296 comparison; &P <0.05 for HCN4 and HCN4+Src529 comparison.
