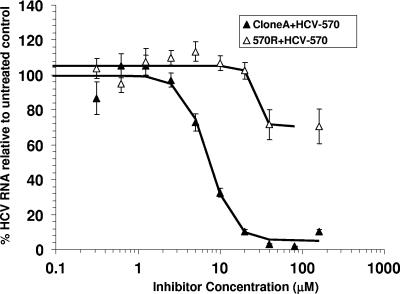
FIG. 1.
Susceptibilities of 570R variants to HCV-570. Clone A and 570R cells were treated with increasing concentrations of HCV-570 for 3 days before total RNA isolation. The levels of HCV RNA were analyzed by a quantitative TaqMan RT-PCR. The y axis of the graph indicates the mean percentage of HCV RNA compared to that for untreated cells, with error bars indicating the standard deviations. Each datum point in the graph represents an average value obtained from four cell replicates; each was analyzed twice by the TaqMan RT-PCR.

