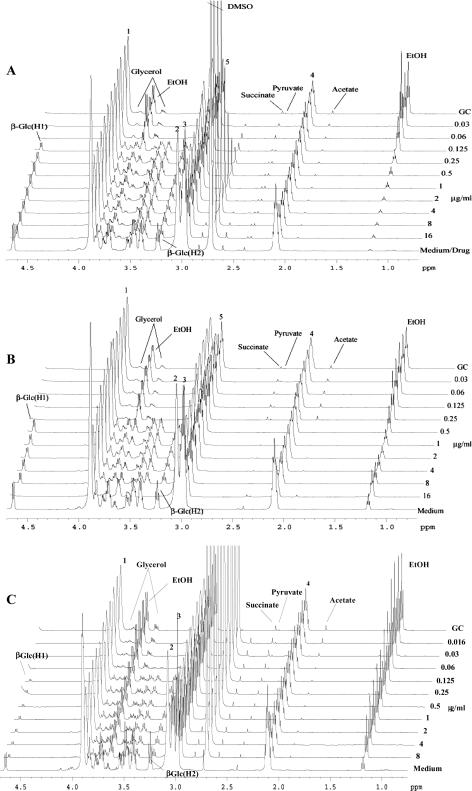
FIG. 2.
Representative 1H NMR spectra of samples of C. albicans ATCC 90028 incubated with AMB (A), caspofungin (B), and voriconazole (C). Drug concentrations are indicated on the right. GC is the growth control; the spectrum of medium alone is at the bottom (for panel A, well 1 contained 16 μg/ml drug in addition to medium). The numbered resonances correspond to the MOPS buffer as follows: 1, O—(CH2)2-(CH2)2-N-CH2-CH2-CH2-SO3−Na+; 2, O—(CH2)2-(CH2)2-N-CH2-CH2-CH2-SO3−Na+; 3, O—(CH2)2-(CH2)2-N-CH2-CH2-CH2-SO3−Na+; 4, O—(CH2)2-(CH2)2-N-CH2-CH2-CH2-SO3−Na+; 5, O—(CH2)2-(CH2)2-N-CH2-CH2-CH2-SO3−Na+. The large peak at 2.7 ppm in panels A and C is due to DMSO used to solubilize the AMB and voriconazole. Concentration-dependent changes in fungal metabolite production (e.g., ethanol [EtOH] at 1.18 ppm) and glucose utilization (resonances at 3.24 and 4.7 ppm) are clearly seen.

