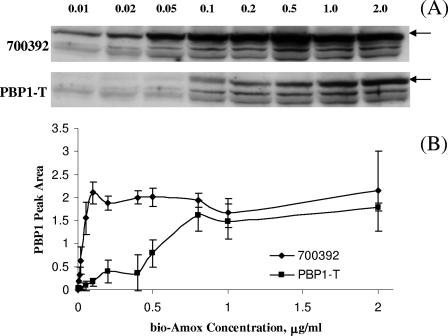
FIG. 1.
(A) Bio-Amox labeling of 700392 and PBP1-T PBPs. Equivalent amounts of membrane proteins were exposed to increasing amounts of bio-Amox to saturation. The numbers indicate bio-Amox concentrations (μg/ml) used to label PBP1. The arrows indicate the locations of the PBP1 band; the two lower bands correspond to PBP2 and PBP3. (B) Quantitative densitometric tracings of PBP1 bands. The data represent the means ± standard deviations based on four separate experiments (including the gel shown in panel A).

