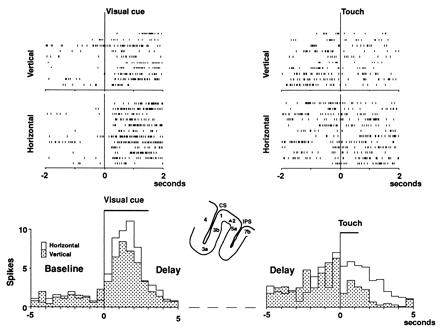
Figure 3.

Rasters and average frequency histograms (bin size, 500 ms) from a unit showing differential activity in the two periods, cue (Left) and choice (Right). On the left, the time-locking event is the onset of the visual cue; on the right, the first contact of the matching object. The middle part of the delay is omitted from the histograms (dotted line). The cell favors the horizontal visual cue (white histogram, P < 0.05). Accordingly, it favors the horizontal ridges (white histogram) at the choice (P < 0.01).
